Features
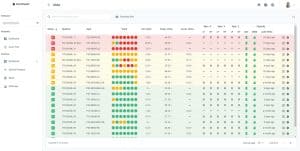
Initial Dashboard
Panel to support decision making with compact information that orders the points monitored by the sensors, descending from the most to the least critical, according to the alarms configured. Also shown are the trend of alerts for the past seven days, temperature and vibration average values and the comparison of spectral analysis on each monitored axis.

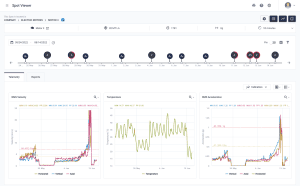
Data History
Presented in graph format, measurements of temperature, velocity and RMS triaxial acceleration are available to identify changes in the machine’s operating pattern, due to the appearance or evolution of faults. It presents moving average data and statistical tools to understand the behavior of the monitored machine.
The data history allows us to obtain information about the effective operating time and the machine downtime. It presents a timeline, above the graphs, in which any user can learn about the events that occurred at the monitored point.

Spectral Analysis
he spectral analysis graphs present data in the domains of acceleration, velocity and displacement. The comparison between spectra is possible, allowing the choice of one as a reference. A bearing database with 70 thousand registered models is available.
Other tools are:
- Waveform and frequency spectra
- Envelope with several filter bands
- High-pass, low-pass and band-pass filters
- Cursors and harmonics markers
- Logarithmic scale to highlight low speed frequencies.
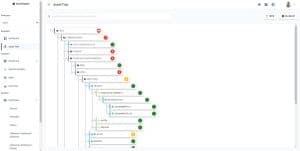
Asset Tree
The starting point for asset management, it presents a hierarchical organization of plants and monitored assets. In this part, users are managed by specific profiles and permissions. The manager profile can have access to a complete view and manage several plants. Vibration analysts can remotely analyze the components of monitored assets at other plants in the organization.


