Descriptions
Noise and Vibration Solutions
Noise and vibration measurements and analyses are increasingly performed to enhance product quality; monitor and diagnosis rotating/reciprocating machinery performance; design more efficient structures and products; and improve our quality of life. In order to optimize the benefits, this process must be examined in a broad sense. Most software packages on the market today do not address each phase of the process needed to reach a complete solution. Typically, these phases are as follows:
- Project Definition and Experimental Design
- Data acquisition
- Data reduction and analysis
- Predictive model development
- Development of possible solutions and strategies
- Report generation
SpectraQuest’s VibraQuest starts the solution process by designing experiments. Then it helps you create a plan to implement the experiments. It collects quality data and performs in-depth analyses. VibraQuest also provides tools to quickly examine the effects of test variables to reveal root causes and develop a predictive model for arriving at solution strategies. Finally, the results can be used to create reports, which can be exported in a variety of different formats and shared with other engineers.
Features
Features and Benefits
- Multi-channel data acquisition, analysis, and modeling system at an affordable price.
- All-inclusive noise and vibration problem solution from definition to resolution.
- Features time and spectrum analysis, statistical analysis, rotating/reciprocating machinery fault diagnosis, induction motor current signature analysis (MCSA),order analysis, long duration data recording, modal testing, and acoustic analysis.
- Automatic data reductions, analyses, and modeling to reveal root causes.
- Export directly to ME’scope for modeling and modal analysis.
- Simple intuitive user interface for fast and easy operation.
- Rotating machinery and induction motor fault frequency calculations and display for quick diagnostics.
- Experimental design with over thirty built-in templates to organize and document testing.
- Real-time operating deflection shape (ODS) analysis using ME’scope.
- Structured for developing predictive models to reveal root causes.
- Simple procedure for project and user management.
- Capability to incorporate non-linear sensor behavior.
Experimental Design and Project Management
Good organization is critical to logical problem solving. It is important to document a project in detail. If not done, there is a tendency to lose information, repeat previous efforts, and misinterpret results. SpectraQuest’s VibraQuest has been developed with scientific testing in mind and configured to encourage you through a step-by-step setup procedure to approach every project or test in an organized and thorough manner. Easy to use wizards guide you through experimental templates that define the test variables and parameters within your project. You can create your own templates or use one of our 30+ built-in templates for different experiments on structures and rotating machinery studies. The entire test can be saved and used to automate the analyses and develop a predictive mode.
- Retains important information and helps to eliminate errors.
- Built-in templates allow you to set up pre-stored parameters for specific tasks.
- Parameters help organizing the tests and simplifying further automated analysis.
- Organizes tests, assures consistency, and saves time.
Data acquisition and analysis are organized in a central control panel. You can access any project or file for in-depth analysis from this screen. You can also edit data acquisition panels and test parameter setups. VibraQuest can host multiple users who are managed by an administrator. Each user has a folder to hold projects, and each project can have many individual tests and analysis reports. The administrator can view, add, delete, and change a user’s settings, such as password and file path. The administrator can also modify some system settings like the sensor database.
Data Acquisition
A new test setup requires considerable time to enter. VibraQuest permits saving setups in a project for quick retrieval for future testing. Accurate data acquisition process is laborious and time consuming in most vibration studies. VibraQuest uses a simple step-by-step wizard to define the data acquisition parameters. Raw data are always saved for future reference and analysis. Time and spectrum functions are also available for real-time analysis.
Data acquisition involves four steps:
- Choose project and specify parameters.
- Define measurement environment.
- Define acquisition parameters.
- Acquire, review, and save data.
Specialized DAQ Setups:
- Steady state test
- Hammer/bump test
- Accelerometer calibration
- Order tracking and start-up/coast down test
- Time synchronous averaging
- Data streaming to a file
- Internal signal generation to verify analysis function and system operation
Specialized DAQ Setups:
- Steady state test
- Hammer/bump test
- Accelerometer calibration
- Order tracking and start-up/coast down test
- Time synchronous averaging
- Data streaming to a file
- Internal signal generation to verify analysis function and system operation
Acquire, Review, and Save:
VibraQuest is designed for quick data acquisition, review, and storage. You can simultaneously review the results and save to a file, which can be exported to a number of different formats.
Sensors and Units:
VibraQuest allows you to setup the sensors to be used in data collection. Numerous sensors and units are programmed for easy access, and you can add your own sensors. You can even define a non-linear sensitivity curve using our polynomial curve-fitting routine. Both the metric and English units are available.
Data Analysis
Projects frequently involve massive amounts of data that must be examined in considerable detail in order to reach a conclusion. Most spectrum analyzers provide the tools for analysis but fail to provide a means to assist in drawing meaningful conclusions. Specifically, manual comparison of numerous sets of variables is very time consuming and overwhelming.Trends cannot be easily discerned through individual examination of waveforms and spectra. In short, mathematical models relating the data cannot be developed without downloading to different proprietary software. VibraQuest overcomes this handicap, making it a powerful solutions tool. The overall approach is as follows:
- Rapidly skim through data and develop the appropriate analysis methodology.
- Apply this methodology to analyze selected groups of data automatically.
- Repeat the same procedure using different parameters to perform in-depth analysis.
- Information coming from each group can be used to observe trends and develop models.
Time Domain Analysis:
Time domain graphs show the raw data. A full screen of data is often unintelligible. Zooming shows details. The graphics have many options, including zooming, changing scales and moving graph. Features include:
- Waveform playback and analysis of selected data sets.
- Detailed statistical analysis to include, average, min/max, RMS, variance,skewness, kurtosis.
- Comparison analysis among unlimited wave forms.
- Comparison analysis among unlimited data sets (channels).
- Waveform power and correlation functions.
- Advanced cursoring to identify spikes with fault sets.
Frequency Domain Analysis:
FT may be applied to individual data blocks or averaged. Data can be displayed to see the variation from block-to-block. You can select linear, logarithmic, or dB amplitude scales. A variety of averages are available including RMS, vector, sum and difference, and exponential. Any channel can serve as a reference for transfer function analysis. There are nine window options available to enhance the data analysis. The data blocks can be resized to examine the results with different spectral resolutions.
DynamiSignal Analysis
VibraQuest provides tools for a comprehensive dynamic signal analysis for structural problems, rotating machinery analysis, induction motor analysis, and general noise and vibration solutions. Data can be analyzed with the ulltra-high resolution of 102.4 k spectral lines. In-depth analysis can be performed using time-synchronous averaging technique. Rotating machinery can be analyzed using the built-in fault frequency calculators.
The results can be displayed in a variety of ways: one, two, four, and eight graph formats. A comprehensive waterfall for three-dimensional visualization is available. Extensive cursoring capabilities are also available, which include two active cursors with delta values and a truly dynamic harmonics and sideband cursors. Data can be viewed using a polar plot, which plots the magnitude and phase angle of selected order of harmonics. Data blocks can be selected to show the transition, and slow-roll compensation is available for balancing and other applications.
All of the data blocks are available for analysis. The user can review and delete any outlying data blocks. Averaging can be performed on any data block(s). Extensive averaging is available; data can be displayed in linear, log, and dB scales. Data from different files can be compared for detailed analysis and trending.
VibraQuest provides the necessary tools for information extraction and data interpretation. The comprehensive analysis panel gives you total freedom and convenience in parameter selection, cursor operation, and data manipulation. You can select any channel or data block to feed into the desired function. Multiple plots or graphs can be used to compare between different files, channels, or data blocks.
Analysis functions:
- Auto power spectrum
- Cross power spectrum
- Power spectral density
- Amplitude spectral density
- Frequency response
- Impulse response
- Coherence
- Bode plot
- Polar plot
- Nyquest plot
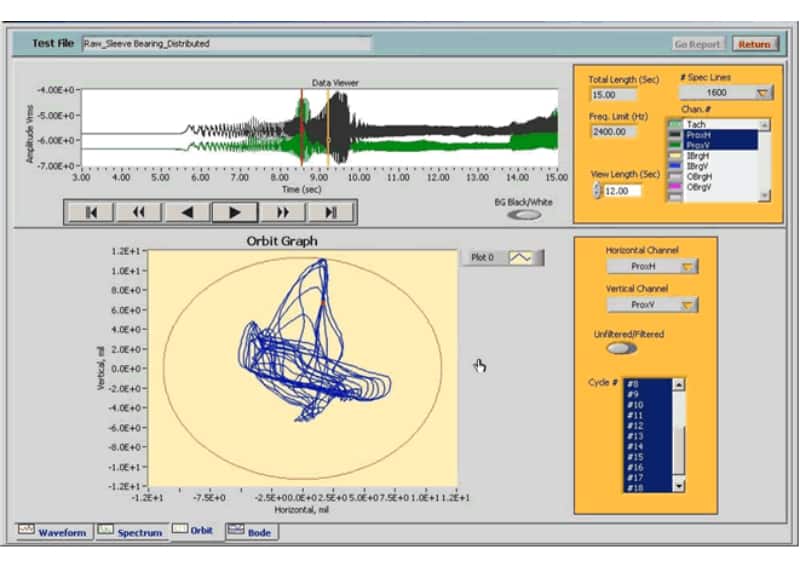
- Orbit plot
- Waterfall plot
Statistical functions:
- Mean
- RMS
- Standard deviation
- Variance
- Kurtosis
- Median
- Mode
- Skewness
- Covariance
- Correlation
- MSE
The conventional digital signal processing is based on equally spaced spectral bins. A representation of actual signal is prone to errors. The errors can distort both the frequency and time domain data. In machinery analysis or modal testing, it is often required to estimate true spectral content of the signal. It is virtually impossible to sample to exactly represent the frequencies present in a real signal. We have developed a proprietary algorithm to determine exact amplitude and frequency of the signals. This procedure enables you to perform more accurate fault diagnosis and natural frequency estimationation.
VibraQuest provides a variety of cursors for in-depth data analysis. Available cursors include: single, double, delta, harmonic, and sideband. You can apply a true peak estimation algorithm to any of the spectral peaks. This is especially useful for harmonics and sideband analysis. In VibraQuest, you can display over thirty harmonic and sideband cursors. The values of the frequencies and amplitude are displayed in a table which can be exported to MS Excel for report generation.
Hammer test is an important tool for obtaining structural dynamic parameters, such as resonance, frequencies, and mode shapes. In order to extract these parameters accurately, it is important to obtain reliable data in the hammer test. You have to be careful about double hammer, damping in exponential window of the hammer channel, and overload. VibraQuest provides tools for setting up and automatically detecting these parameters. You can reject double-hit data while averaging the hammer test results.
Acoustic Analysis
This module is a simple but powerful tool to analyze acoustic signals. It includes full and fractional octave functions with linear, A, B, and C weighting options. It also provides the capability to measure the sound levels. You can combine different sound level measurements and use them simultaneously. Data can be averaged in three different modes: linear, exponential, and peak. The exponential averaging supports slow, fast, impulse, and user-defined modes for tracking different sound pressures and time varying acoustic signals. Fractional-octave analysis is a widely used technique for analyzing audio and acoustic signals. There are many options available for selecting bandwidth and filter banks, filter settling times, and averaging for in-depth analysis. Both the ANSI and IEC standards are available for octave analysis. Results can be displayed in a variety of ways.
Features & Advantages:
- Full, 1/3, 1/6, 1/12, or 1/24 octave spectrum
- A-, B-, C- or flat weighting options
- Selectable display bands
- Selectable averaging modes of Linear, Exponential, Equal confidence, and Peak hold
- Band power table
- Simple, cost-effective acoustic analysis functions
- Related acoustic signals to vibration problems
Reporting
VibraQuest provides a built-in feature to create customized reports and export them to various programs, such as Microsoft Word, Excel, and HTML format. The reports can be created simultaneously while analyzing the data to save time and maintain the continuity of the analysis. Reports can be saved for future reference. This feature is available for all the modules of VibraQuest.
Modules
Induction Motor Fault Diagnosis
Induction motors are the mostly used electrical driven system. Motor current signature analysis (MCSA) is a useful analysis and condition monitoring technique for the health of induction motors. With the Induction Motor Fault Diagnosis for VibraQuest, you can perform fault frequency calculation for diagnose problems, such as broken rotor bars, turn-to-turn shorts due to insulation breakdown, single phasing or loss of one phase, phase imbalance, both the static and dynamic eccentricity, and bearing defects. MCSA can detect these problems at an early stage and avoid consequent damage and catastrophic failure of the motor.
MCSA is the most widely used technique to analyze and monitor the health of induction motors. The Induction Motor Diagnosis module for VibraQuest provides five types of induction motor defects: broken rotor bar, stator short frequencies, static eccentricity frequencies, dynamic eccentricity frequencies, and mechanical influence frequencies. A graphical rendition of the fault with a detaied description is provided as well. Due to the complexity of the loading on induction motors, analysis is not often easy and the severity of defects is difficult to determine. This module also provides advanced signal processing tools such as demodulation for detecting malfunctions. Using the calculation templates, you can select the fault and display the fault frequencies an the spectra. Data can be viewed and exported in a variety formats. The software also allows you to compare motor current with vibration spectra.
Features
- Automatic machine fault frequency identification and spectrum mapping
- Choice of bearing, gearbox, fan, belt, pump, and user-defined frequencies
- Available gearbox types: two-element, four-element, epicyclic gearbox (with Planetary, Star, and Solar configuration)
- Enveloping function for fault detection of rolling element and gearbox
- Ultra-high resolution with up to 100,000 line FFT
- Illustrated explanation of selected frequencies
Advantages
- Built-in template for calculating fault frequencies caused by various sources
- Excellent tool for diagnosis of local faults in rolling element bearings, gearbox, and turbine blades
- Insight of operating machines without shutting them down
- Designed for all four types of bearing faults for any particular bearing: BPFO, BPFI, BFF, and FTF
- Identification of vibration signatures of a machine
Envelope analysis
Airgap eccentricity, broken rotor bars, bearing damages, and time-varying load all cause sidebands in the current spectrum. Envelope analysis is a useful tool to detect these characteristic frequencies. The envelope analysis function in VibraQuest is based on an innovatively improved Hilbert transform method. This improved demodulation method attenuates the influences from high frequency contents and makes the envelope frequency easier to be identified.
Rotating Machinery
Rotating Machinery module for VibraQuest provides powerful tools for analyzing and diagnosing faults in rotating/reciprocating machinery. This module includes an extensive database of over 25,000 bearings from major manufacturers for calculating bearing faults. Fault frequencies associated with gearboxes, belt drives, pumps, fans, and other user-defined mechanical components can be calculated and displayed. You can also apply several advanced signal processing techniques for analysis and diagnosis.
Rotating machinery produces vibration signatures depending upon the mechanism involved. The purpose of analysis is to identify the forcing frequencies so that root cause can be addressed and corrective action can be taken. The Rotating Machinery module for VibraQuest has built-in template for calculating fault frequencies associated with various mechanisms of typical machinery.
Features
- Automatic machine fault frequency identification and spectrum mapping
- Choice of bearing, gearbox, fan, belt, pump, and user-defined frequencies
- Available gearbox types: two-element, four-element, epicyclic gearbox (with Planetary, Star, and Solar configuration)
- Enveloping function for fault detection of rolling element and gearbox
- Ultra-high resolution with up to 100,000 line FFT
- Illustrated explanation of selected frequencies
Advantages
- Built-in template for calculating fault frequencies caused by various sources
- Excellent tool for diagnosis of local faults in rolling element bearings, gearbox, and turbine blades
- Insight of operating machines without shutting them down
- Designed for all four types of bearing faults for any particular bearing: BPFO, BPFI, BFF, and FTF
- Identification of vibration signatures of a machine
Fault frequencies
For rolling element bearings, when the rolling elements strike a local fault on the inner or outer race, or a fault on a rolling element strikes the inner or outer race, an pact is produced. The bearing frequencies can be dented as BPFO (ball passing frequency outer race), BPFI (ball passing frequency inner race), BFF (ball fault frequency), and FTF (fundamental train frequency). Using the Rotating Machinery module, rolling element bearing frequencies are specified from item loaded from database. Other available frequency categories include gearbox frequency, primary belt frequency, belt resonance frequencies, chain drive frequency, and fan blade pass/pump vane pass frequencies. Faulted frequencies can be mapped on the vibration spectrum.
Envelope analysis
Gearbox and rolling element faults generate amplitude modulation which causes sidebands in the spectrum. Envelope analysis is a useful tool for amplitude demodulation. The envelope analysis function in VibraQuest is based on an innovatively improved Hilbert transform method. This improved demodulation method attenuates the influences from high frequency contents and makes the envelope frequency easier to be identified.
Data Streaming
In many applications, it is important to collect data for long periods of time. Data Streaming module for VibraQuest allows you to capture, view and store long-duration and high-speed multi-channel data acquisition simultaneously. You also can use play-back panel to post-analyze the data with all the analysis functions and Parameters which are available for steady-state data analysis.
Sometimes we need to collect data for a long period of time before we can see transient phenomenon. Long-duration data acquisition is also important in automotive testing, machinery fault diagnosis and analysis. All the signals have to be continuously sampled at high speed to capture all the events associated with the test objectives. In order to ensure the fidelity of the data, it is necessary to display the data in some format while streaming and saving. The Data Streaming module can acquire data with speed up to 5 mega-samples/second. You can view multi-channel waveforms or spectra in real time. The captured data can be post-analyzed using the stream play functions which include time waveform, amplitude spectrum, frequency response function, coherence, orbit, and Bode plot. You can go through the data quickly using fast forward/reverse buttons, similar to those found on a tape recorder, or simply by dragging the lead cursors. The data segments are user-selectable, as is the block size for the FFT-calculation. All the time and frequency domain functions are available for data analysis. The data can be exported into universal ASCII format and ME’scope data format.
Features and Advantages
- High-speed multi-channel data streaming to hard disk
- Record long records of gap-free data for future in-depth analysis
- Indication of disk volume and maximum recording time
- Turn on/off display while recording
- Choice of buffer drive
- Play back any gap-free data
- Control of display length and data block size
- Playback buttons include: back to beginning, fast rewind, last block,next block, fast forward, forward to the end.
- User can drag cursors to any position to get the data segment for analysis
- Convenient tool to view the overall characteristics of data
- Unique playback functions allow flexible data view
- Easy report generation
Transient Analysis
In structural dynamics, machine diagnostics, and many applications, a signal may be nonstationary. The Transient Analysis module for VibraQuest provides powerful tools to analyze the features of transient signals using joint time-frequency and wavelet transform. With our advanced analysis algorithms, you can view the power distribution of a time-dependent signal using variety of approaches, extract transient features, perform fast time-varying filtering, and reduce random noise.
The fast fourier transform (FFT) is the most widely used signal processing approach nowadays. However, the FFT has some drawbacks. First of all, the Fourier transform gives an averaged spectrum of a time signal over the entire time interval. A FFT-based spectrum can not detect the instantaneous frequency change, nor display how a frequency component evolves with time. A satisfied frequency resolution requires a long signal. Transient signals generally last in a very short time with fast frequency change, for example, engine knocks. For such a signal, the FFT spectrum is not able to catch the transient features, and the frequency resolution is low. In addition, if the fundamental frequency of a signal increases/decreases in time, the bandwidth of this frequency component in the FFT-spectrum becomes much wider than its real bandwidth. The faster the change of frequencies or amplitudes, the wider the bandwidth. During a starting-up or shutting-down test of a rotating machine, the bandwidth of the fundamental frequency and all the harmonics widens, which makes all the harmonics overlap in the frequency domain. Therefore the FFT spectrum is no longer able to distinguish the vibration caused by different source. Using advanced signal processing techniques, such as joint time-frequency and wavelet transforms, you can overcome the limitations of the FFT mentioned above
Features
- Gabor analysis
- Short-time Fourier transform
- Time-varying filter
- Order control smoothes Gabor spectragram
- Reassigned STFT improves the resolution of spectragram
- Analytic signal reduces cross-term interference in Wigner-Ville distribution
- Analytic wavelet scalogram
- Mean instantaneous frequency
- Wavelet-based noise reduction
- Easy report generation
Advantages
- Joint time-frequency spectragram shows how the frequency components evolve with time
- Time-varying filter allows you to filter out component whose frequency changes
- Short-time signal characterization
- Transient feature detection: time varying harmonics, peaks, discontinuity
- Time signals reconstructed from time-frequency analysis have better SNR than the FFT method
Clarify patterns of frequency changes
One major benefit of applying the Transient Analysis module to a signal is to discover the pattern of frequency changes, which often clarifies the nature of the signal. Once you identify a pattern, you can analyze and classify the pattern. The figure on the right shows the Gabor spectrogram of a signal obtained from a fluid-film bearing machine during a starting-up and shutting-down test. The horizontal and vertical axes are time and frequency, respectively. Different colors represent the power distribution. The frequencies associated with the running speed (1X) as well as the harmonics are clearly seen. When the running speed meets the first resonance frequency of the shaft, the energy reaches a maximum point. The oil whirl and whip are also clearly shown.
Time-Varying Filter
As mentioned above, different frequency contents of a transient signal may overlap in the frequency domain. You can use time-frequency analysis to distinct time-frequency components, perform time-varying filtering and reconstruct these components for further analysis. The figure below shows the procedure for a machine starting-up signal. On the time-frequency color map, the frequencies associated with the running speed and the harmonics, and the resonance quency of the bending vibration are clearly distinguishable. Three time-frequency components can be separated using three mask matrices. The random noise is amazingly reduced. Then the three components can be reconstructed to the time domain.
Order Analysis
Order analysis is a format of harmonic analysis specially designed for rotating or reciprocating machines. Order Analysis module for VibraQuest provides you powerful tools for rotating machinery diagnostics. With our advanced analysis algorithms you can perform RPM calculation, measurement of the power distribution in terms of RPM or frequency, extraction of any order component, measurement of the magnitude and phase of any order component, and examining signals in different presentation format.
Common mechanical phenomena in rotating/reciprocating machinery are related to the rotational speed of the shaft. In the conventional frequency analysis, a signal is sampled at instances with the fixed-time interval. However, the running speed of a rotating machine is generally not constant. Speed fluctuations are common in machines operating under load varying conditions. Sometimes it is important to examine the start-up or shut-down conditions. In these cases, the conventional frequency analysis produces significant spectral smearing or leakage, which makes it difficult to detect defects associated with various mechanisms. With tachometer, a signal can be sampled with fixed-angle interval, which avoids the problems mentioned above. Our Order Analysis module provides state-of-art Gabor expansion-based order analysis method, as well as resampling method or on-line order tracking.
Features
- On-line order tracking and spectral map
- Digital and analog tachometer processing
- Designed to separate RPM-synchronous and non-synchronous components
- Automatic order selection tools to extract the most significant orders
- Real-Time data resampling and order spectrum
- Order extraction without tachometer
- Waterfall, color maps, orbit, centerline, Bode plot, polar plot
- Slow roll compensation
- Fast and easy report generation
Advantages
- Accurate RPM estimation leads to robust order spectrum calculation and order extraction
- Useful tool to reveal critical speeds, resonances, oil whirl/whip, instability, and load fluctuation effects
- Amplitude and phase of first order for balancing and foundation diagnoses of industrial rotors
- Isolation of order interaction
- Versatile and colorful data presentation allows better interpreting data
- Measure power distribution in terms of RPM/time/frequency
On-line Order Analysis and Data Acquisition
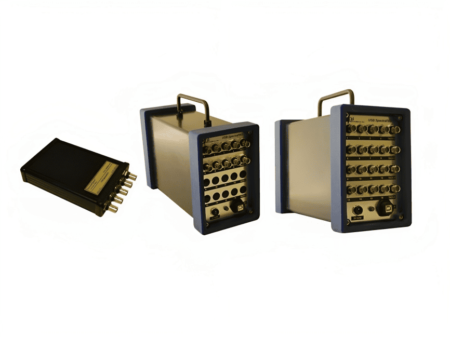
Our data acquisition (DAQ) system can measure digital/analog tachometer, ICP transducer, proximity probe and all standard industrial transducer signals. The DAQ devices possess high dynamic range (110/118 dB) and wide bandwidth (102/204 kHz). The on-line order analysis provides full capabilities to display the order spectrum, spectral map, waterfall, orbit, and Bode plots.
Tachometerless Order Analysis
For test environments where the tachometer is not available, the Gabor analysis-based order tracking allows you to compute the rotating speed information by performing some interactive operations on the spectral map.
Slow Roll Compensation
The slow roll vector can be automatically extracted from a low speed signal for slow roll compensation.
Functions
Order Analysis module allows you to perform the spectrum averaging in the following weighting modes: rms, vector, and peak hold. This module also provides order power spectrum, order magnitude, and order phase.
Displays
You can select the color maps and waterfall plots in the following formats: Frequency-RPM, Frequency-Time, Order-RPM. Order Analysis module also can display Orbit, Centerline, Bode, and Polar plots.


